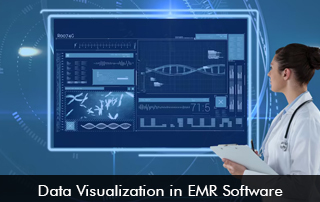
Data visualization and analytic tools in Electronic Medical Records (EMR) Software are now critical for every healthcare organization to succeed and become more competitive. The global healthcare data analytics market is estimated to grow 3.5 times in only six years. The increase in data visualization has been due to the COVID-19 pandemic bringing information and data into the spotlight to provide meaningful insights. EHR Software Visualization of data helps healthcare organizations operate effectively by using charts, tables, or graphs to interpret data promptly and support the decision-making process.
What is Health Data Visualization in EHR Software?
Medical data comes from various sources such as Electronic Health Records (EHR) Software systems, hospital management systems, laboratories, IoT devices, and billing and coding software solutions. Data visualization tools in software systems help this data to transform into visuals so healthcare professionals can recognize various trends and interpret analytics results faster.
Examples of Data Visualization Tools in EMR Software
Visualization tools of today can be used by different stakeholders in the healthcare sector such as healthcare providers, government officials, and patients converting complex data into visuals that can be easily comprehended. Here are some examples of modern visualization tools used by healthcare organizations in the US.
Interactive Dashboards
Interactive dashboards in electronic health records software are the most regularly used data visualization tools by healthcare organizations. They provide the functionality of interactive reports which can help to display real-time data or show trends over time.
Patient Timelines
Knowing the right sequence of a patient’s medical events is critical to delivering the right care to them. This is where the patient timeline feature in EMR Software becomes useful. Providers can use these timelines to see the display of diagnoses, treatment, and hospital visits of a patient.
Heat Maps
The purpose of heat maps in Electronic Health Records Software is to pinpoint any areas that require attention in patient records. Heat maps visualization tool is a great way for clinicians to identify high-risk patients and assess the spread of a disease. Timely medical interventions can reduce fatal events.
Benefits of EMR Software Data Visualization in Healthcare
EHR Software data visualization is a robust tool that can facilitate the improvement of patient care by helping medical staff members identify different dangers. Real-time visualization of patient health status can help doctors categorize patients according to treatment plans. Patient records in Electronic Health Records Software provide all critical information in a single dashboard which improves treatment effectiveness.
Data from remote patient monitoring devices and fitness apps integrated into the EMR Software can be used to recognize trends and reveal any health risks to the surface. Healthcare data visualization also helps governments to enhance decision-making related to public health.
Data visualization tools harnessing the power of Artificial Intelligence (AI) and machine learning can be used to eliminate errors and detect any scams in medical billing and patient prescriptions. This can help provide seamless patient services and keep them satisfied.
Moving Ahead
Modern healthcare relies heavily on data visualization capabilities in EMR software because they make complex data understandable and useful. These tools facilitate clinical workflows, enhance patient outcomes, and assist healthcare providers in making well-informed decisions. The incorporation of sophisticated data visualization features in Electronic Medical Records Software technology is expected to grow in significance over time.


